60+ Amazing Internet Usage Statistics UK Edition [2024]
Last Updated: February 9, 2024
Have you ever wondered how many people in the UK use the Internet? Sure, you did. Well, if 2020 were a race, Internet usage in the UK would’ve broken all the records, considering an estimated number of 62 million internet users that year alone. That’s almost the entire UK population.
If you are eager to find out more interesting Internet usage statistics UK edition, we prepared great content, so stick with us.
Before we dive into analysing, we’ve highlighted some of those interesting facts about internet usage:
Top 10 Internet Usage Statistics UK Edition
- The estimated number of internet users in the UK in 2020 was 62 million.
- In April 2020, internet users in the UK spent an average of 4 hours and 2 minutes online per day.
- Out of all the evaluated time spent online, 71% of users were on smartphones.
- In 2020 only 4% of all households in the UK didn’t have internet access.
- Social media statistics revealed that in 2020, 28.7% of UK users needed to use social media for work.
- 46.6 million internet users in the UK are daily accessing the internet.
- Internet user penetration rate in the UK for 2020 is 95.53%.
- In 2021, 86% of the UK online population was using the Google search engine.
- In 2020, 76% of individuals used online banking regularly in the UK.
- Zoom had 659,000 UK users in January 2020, and then it hit a milestone with 13 million consumers, in April same year, making this a rise of approximately 2,000%.
Now let’s get down to a more detailed report.
Internet Usage Statistics UK
Have you ever wondered how widespread internet usage in the UK actually is or what percentage of the UK has the Internet? Next statistics shed some light on that, actually.
- Internet user penetration rate for 2020 is 95.53%.
- The mobile internet penetration rate in the UK for 2020, is 90.3%.
With the number of 55.5 million people in the UK who were smartphone owners in 2019 rising, it is safe to say that the entire UK population will soon be using the internet. According to Statista, by 2025, the penetration rate is expected to rise to 97.5%, making its peak imminent.
While we are at it, check out how many homes in the UK have internet access:
- In 2020, 96% of all UK households had access to the Internet.
To illustrate, 100% of households with two members aged 16 to 64 had internet access, compared to the 80% of households with one member older than 65.
Let’s see what the average time that people spend on the internet in the UK was.
- According to Ofcom, the British spent 4 hours and 2 minutes online in April 2020.
- In 2020, 89% of internet users in the UK reported using the Internet every day.
People already spend a substantial fraction of their day online, and that fraction isn’t going to decrease any time soon.
You might wonder what days in a week have the most internet traffic in the UK? If so, the following statistic has the answer.
- According to BBC, the peak time for being on the internet in the UK is 21:00 on Wednesdays, while the quietest time is 04:45 on weekdays.
The lowest data flow is on Saturday nights and is generally lower on weekends and holidays.
- In 2020, the average broadband speed in the UK increased by 18% compared to the year before.
- The average residential download speed in the UK between November of 2019 and March of 2021 was 50.4 Mbps.
However, this increase is most accurately attributed to package upgrades, not service improvements.
Below, you can see the number of domains bought in the UK.
- There were 9,540,775 third-level and 1,313,273 second-level domains under management in the UK, in November 2020.
If you think that Google is the most popular search engine among UK internet users, you are absolutely right.
- In 2021, 86% of the UK online population was using the Google search engine.
- On average, UK internet users spend 5 minutes 37 seconds each day on Google search.
To no one’s great surprise, Google search is dominating among search engines in the UK. When asked, in a survey by Statista, which engines they searched the web with in the past four weeks, about 94% of people mentioned only Google’s.
Internet Usage Statistics UK: Growth Trends
As we have seen, Internet trends grow quite a bit each year, and this phenomenon is not stopping any time soon. To better understand the UK’s access growth, take a look at the following graphics from Statista that we have prepared for you.
In the graphic we have prepared, internet usage statistics UK reveal the number of daily internet users in the UK from 2006 to 2020.
Keep in mind that numbers are presenting daily internet users in millions.
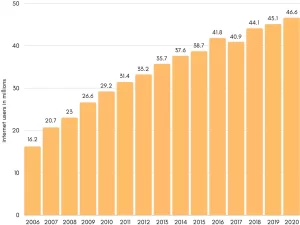
Here we have Statista’s predictions regarding the number of internet users in the UK and we will point out some stats from the previous years to demonstrate Internet user growth trends in the UK.
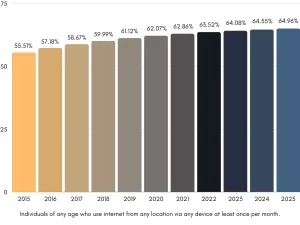
- The number of active UK internet users is predicted to reach 64.96 million in 2025, with an increase of almost 3 million new users from 62.07 million users expected by the end of 2020.
A lot changed by the end of 2020, but did those changes affect internet usage behaviour trends? Most definitely.
For starters, E-Commerce in the UK rose by 10% since 2017.
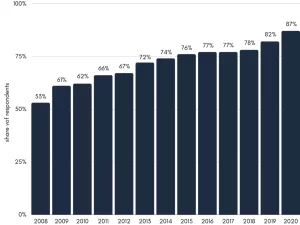
This popular online activity is showing exponential growth in the UK.
- Since 2017, e-commerce in the UK rose by 10%, with 87% of UK internet users shopping online in 2020.
- Clothing and sports goods were the most popular amongst UK online shoppers, with 60% of respondents purchasing these online. In comparison, 49% of consumers reported buying household goods on the internet in 2020.
In the UK’s e-commerce market, the distinguished sector is retail.
- In November 2021 internet sales amounted to 30.1% of all retail sales in the UK.
The biggest increase in online retail popularity coincided with the rising Covid19 restrictions in February of 2020. By May 2020, this percentage rose from February’s 19.1% to 32.8% and oscillated around the 30% mark in the following year and a half.
With these UK internet usage statistics in mind, it’s safe to say that e-commerce will only keep expanding in the future.
Another online activity, for which 2020 was a beneficial year, is online banking.
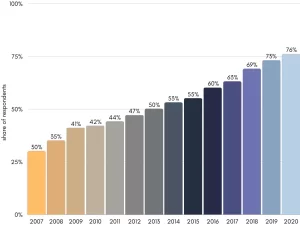
Online banking is one of the fastest-growing activities on the internet.
- In 2020, 76% of individuals used online banking regularly.
Considering the statistic above, we can say that smartphones are in the lead when it comes to the favoured device used for online banking in the UK.
In 2020, COVID-19 had a significant impact on internet trends and online behaviour in the UK. We will cover more on this topic later, so stick around.
Internet Usage Statistics UK: Demographics
We begin with internet usage by age in the UK in 2020. This is a statistic for internet usage via any device, in any location.
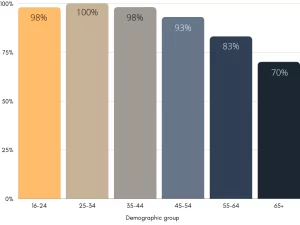
- Presented statistics reveal that internet usage in the UK was highest among younger individuals, with 99.5% of participants aged 25-34 using the internet.
On the contrary, older age groups are showing a decrease in internet usage.
- 94.6% of people aged between 55 and 64 actively used the internet in 2020.
- A smaller portion of those aged 64 to 75 used it, 85.5% of them.
- As for those older than 75, 54% reported using the internet once in the three months prior to the survey.
Let’s shed some light on Internet demographics by gender in the UK.
- In 2020, the UK’s highest internet penetration of 99.6% was among women aged between 25 and 34.
- The penetration rate among men of the same age group was 0.2% lower, being 99.4%.
- The lowest internet penetration of 49.8% was among women aged over 75 years.
What about internet usage by regions in the UK? Which UK towns have the highest penetration of internet users?
- In 2020, London and South East had the highest recent internet usage with 94.9% and 94.2%, respectively.
- On the other hand, Northern Ireland had the lowest percentage at 88%.
Can you guess who has more internet users, the UK, or the US?
- In 2020, the UK had nearly 62 million internet users, while the US had 284 million.
The US has more internet users, but…
- Internet user penetration is higher in the UK with 95.53% while for the US the number of percentages is 85.8%.
We noticed that a significantly high percentage of the UK’s population was using the internet in 2020, so we decided to dig a bit deeper regarding internet activities.
Most Popular Internet Activities in the UK
Internet users in the UK access the internet mostly to send and receive emails, Statista reveals.
- 86% of men and 85% of women participants in Statista’s survey accessed the internet for email communication in 2020, making it the most widespread online activity.
- The second most popular activity is finding information about goods or services, with 83% of men and 80% of women searching for these online.
- 76% of both men and women use internet banking.
- Social media and instant messaging services are used by 69% of men surveyed. Meanwhile, women percentages are 72 and 74.
- Reading news online is another popular activity, with 74% of men and 67% of women respondents reading newspapers and magazines online.
The most popular online activities by demographics in the UK are a bit different.
The differences in internet activity by gender are that men preferred watching video content, while women were more interested in searching for health-related information.
Email is the most prominent online activity across all age groups, with the exception of the younger population,16 to 24-year-olds who spend most of their online time on social media. But how much time did users spend on social networks?
- Ofcom’s research shows that UK visitors aged 18+ spent 49 minutes daily on social media sites. By comparison, this is 18 minutes more than they spent on gaming sites and 37 minutes more than on news sites.
- Younger adults (18 to 24-year-olds) spent more time than the overall average on social media, precisely 1 hour and 20 minutes each day. In contrast, people who are 54+ years old spent less time with 29 minutes on average.
If this was not enough, we got social media statistics in the UK.
- 92% of the time spent on social media in the UK was via mobile devices, including smartphones and tablets.
- Facebook (including Messenger) is the social media site with the highest reach of the UK online population with 95%.
- Instagram holds second place with 60% reach among UK online adults older than 18.
- TikTok was a new entrant to the top ten UK social media sites in 2019, reaching 10% of online adults aged 18+.
Down the road, we will talk more about social media and the most popular apps.
Significant differences in internet use were noticed among socio-economic groups; Here is what Statista’s survey revealed:
- In 2020, over 45% of AB social groups used the internet broadly, which means they carried out immense diversity of activities. Meanwhile, only 22% of UK users in the DE category did so.
We can see that occupation, education, income, wealth, and all other socio-economic factors have an impact on internet usage in the UK. But wait and see how trends change in the UK based on device usage in the next segment.
Internet Usage Statistics UK: Devices
The following statistics will reveal which are the preferred devices in the UK when it comes to internet usage. As mentioned, smartphones were the dominating device in the UK for social media or banking activities, but how do they rank for other internet activities in the UK?
- In 2020, 60% of respondents in Statista’s survey said they mostly use smartphones for internet access, while 16% reported using laptops.
According to Statista’s 2020 research, a larger number of Internet users in the United Kingdom stated that smartphones, over other devices, are their go-to device for accessing the internet.
Regarding the share of web page views in the UK in 2020 by device, statistics reveal the following:
- Of all surveyed users aged 16 and above 85% used their smartphones to go online, 74% used their computers, and 51% used a tablet device.
When it comes to the number of UK mobile internet users in the future, Statista just might have an accurate prediction.
- In 2025, the number of mobile internet users is estimated to reach 64.83 million, which would be an increase of almost 3 million new users from 62 million in 2020.
Check out more stats from Ofcom’s research about internet-connected devices in UK households in 2020.
- 33% of respondents reported having at least one smart device in their home (this is without considering smartphones and smart TVs), and 43% of them were aged between 35 and 54.
- 22% reported having a smart speaker in their household, while 18% had smartwatches or wearable fitness trackers.
- 11% of all UK homes in 2020 had some sort of internet-connected devices, considering devices like smart home security, smart lighting, or smart heating.
Smart technology will indeed become a big part of our everyday lives in the future.
The time has come to talk more about the most popular websites and apps.
Most Popular Websites and Apps in the UK
What are the most visited websites in the UK, you might wonder? Take a look below to find out.
- According to both Semrush and Similarweb, Google was the most popular website in the UK, scoring a minimum of 2 billion visits in December 2020.
- Amazon reached at least 64.5 million individual visits, and eBay at least 44.2 million.
- Microsoft sites have had a steady reach of the UK population in the last couple of years, with around 87%.
- BBC.co.uk was the fourth most popular site in the UK, in December 2020, having 701 million total visits. The first three were Google, YouTube, and Facebook.
Now we can take a look at some of the most used websites in the UK, according to the time spent on the platforms.
- In December of 2020, UK users spent the most time on YouTube. On average, their sessions on this platform were 22 minutes and 43 seconds long.
The adult video platform XNXX ranked second, with users spending 15 minutes and 31 seconds in a session. Google and Twitter ranked 3rd and 4th, with session lengths averaging some ten seconds short of 12 minutes.
What percentage of the UK is on social media? What are the most used apps in the UK? Find out in the upcoming stats for social media usage in the UK.
- Social media statistics in the UK show that the number of active users in 2020 was 45 million, which is 66% of the total population.
- In the third quarter of 2020, 96.4% of people surveyed by GlobalWebIndex reported visiting or using a social network or messaging service in the prior month. 28.7% of them used social media for work.
- 27% of social media users in the UK use it for work purposes
In January 2020, the most used social media platforms were:
- Youtube with 78% of social media users aged 16-64;
- Facebook with 73% reach among the digital population;
- WhatsApp in third place with 62% of users;
- Facebook Messenger, which alone had 58% of consumers;
- Instagram, reaching 49% of internet users;
- Twitter, with its 45% penetration rate, compared to the total internet user population;
- LinkedIn, with its share of the population at 28%;
- Pinterest and Snapchat with 25% of users, each;
- TikTok, with a predicted penetration rate of 21.1%.
We can notice that Facebook-owned platforms (Facebook with Messenger, WhatsApp, Instagram) are most likely to continue being among the most popular social media platforms.
Internet Usage Statistics UK: Top Mobile Internet Providers
Here we’ll take a look at the top mobile, home, and business internet providers in the UK.
Here are some internet usage statistics UK for home internet providers.
- According to ispreview.co.uk’s research top five fixed internet service providers by subscriber size in the UK in 2020 were:
- BT (PlusNet, EE) had an estimated number of 9,300,000 users.
- Sky Broadband was second with approximately 6,200,000 consumers.
- Virgin Media had 5,365,400 subscribers.
- TalkTalk had an approximated number of 4,220,000 users.
- Finally, Vodafone UK had 838,000 users.
What about the most used mobile service providers in the UK in 2020?
Statista’s research in the first half of 2020 revealed that the most popular network provider’s award goes to three companies.
- With 27% of respondents using each of them, first place holders were EE/Orange/T-Mobile.
- The second was O2, with 22% of mobile internet users who participated in the survey.
- Vodafone UK was the third mobile service provider, with 16% of respondents using the service.
The business internet service provider is an integral part of all companies since they require a stable and fast connection to work successfully.
- According to Uswitch.com top business internet provider is TalkTalk Business with a speed of up to 17Mb. The second place went to Plusnet that provides speed up to 76Mb, Virgin Media for business is third and has sped up to 350Mb.
We can’t say who is the best Internet provider in the UK, because the answer depends on the users’ needs. What we can say for certainty is who the fastest internet provider in the UK in 2020 was.
- Virgin Media was, and to this day still is the fastest internet service provider in the UK. Its maximum network package offers an average download speed of 516Mbps.
The time has come to talk about COVID-19’s impact on internet usage statistics UK.
Internet Usage Statistics UK: Impacts of COVID
While the period spent in lockdown, brought upon by the pandemic, was disadvantageous for most industries, the internet industry gained more users and an overall increase in usage.
What do you think thrived the most during these challenging times? Let’s see what Ofcom’s survey reveals.
Websites and apps that entertain people, allow them to explore their creativity and avoid everyday boredom, have never been this popular.
- TikTok, the short-form video platform, had an estimated number of 12.9 million UK visitors in April 2020, which is an astounding 5.4 million more than in January the same year.
- Twitch, the live streaming platform for gamers, had an increase in UK consumers from 2.3 million to 4.2 million.
- During the lockdown, 40% of UK adults and 59% of older children who use video-sharing sites and apps have created and uploaded their own content.
Pandemic has changed our work habits and has transformed our homes into our offices. This, naturally, led to:
- The immense growth in the use of Zoom, a virtual meeting platform, reached 659,000 users in January and then in April-13 million UK consumers, making this a rise of about 2,000%.
- Microsoft Teams grew from 3 million users in January to 6.5 million in April 2020 in the UK.
Online services, as a means of communication, showed an increase in use. Logically, since lockdown enables face-to-face interaction, Facebook Messenger, WhatsApp, and FaceTime served this purpose. UK internet users made video calls at least weekly during COVID-19 lockdown.
- WhatsApp was reaching 49% of UK users in May 2020, which is up from 20% in February.
- Facebook Messenger reached 41% of UK consumers in May 2020, while its reach percentage was 18% in February.
- FaceTime went from 13% to 30% of UK users in the same time frame.
- Additionally, Houseparty, an app that enables group video chat alongside games and quizzes, made an increase from 175,000 UK visitors in January to 4 million users in April 2020.
Internet usage statistics UK reveal that this increase is especially present among older internet users.
- Percentage of online adults aged over 65 that make a minimum of one video-call each week rose from 22% in February 2020 to 61% in May 2020 in the UK.
It’s safe to say that we have the internet to thank for keeping us entertained and in touch with our friends, families, and coworkers during the pandemic.
Wrap up
Over the years, the Internet has become a massive part of our lives; and Internet usage statistics UK indeed demonstrate this fact. Maybe we can even say that we couldn’t live without it since lockdown has highlighted its importance and benefits. Well, of course, we could but not in the way that we are already used to.
Interestingly enough, this phenomenon still has space for development. All we have to do is fasten our seatbelts and enjoy the ride.

![How to Sell on Depop in the UK [2024 Guide]](https://cybercrew.uk/wp-content/uploads/2023/06/Selling-on-Depop-UK.png)


