![30+ Smartphone Usage Statistics for the UK [2024]](https://cdn.cybercrew.uk/images/posts/smartphone-usage-statistics-uk/large.webp)
What is the one thing we cannot live without?
Air, water, food and roof over our heads are the regulars. If you also thought of a mobile phone, you are not alone! Smartphones, as we call them for a while now, have become such an integral part of our everyday routine.
Did you know that in 2021 the number of smartphone users in the United Kingdom rose to 53.5 million, making it 78.9 per cent of the population?
Crave for more? Check out these Smartphone usage statistics UK, up next.
Top 10 Smartphone Usage Statistics UK
- 87% of adults in the UK owned smartphones in 2020.
- The mobile internet penetration rate in the UK was 72% in 2020.
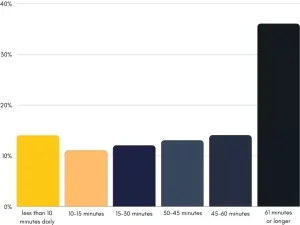
- An average person in the UK spends 148 minutes on a smartphone.
- Smartphones make up to 47.3% of online traffic in the UK.
- The UK has the second-highest smartphone penetration rate in the world at 78.9%.
- Email correspondence using a mobile phone was the most frequent activity among internet services in the UK.
- In January 2021, 97.5% of people in the UK used a smartphone to access their social media platforms.
- 46% of people in the survey said that they use smartphones more than before Pandemic.
- 100% of people in Generation Z use mobile phones.
- As of 2021, 54.79% of the mobile vendor market share in the UK belongs to Apple.
In the following article we delve into such interesting facts about smartphone usage, and many more, so stick around.
Smartphone Usage Statistics UK
Before we go into more statistics about mobile phone usage, let’s see how many UK people own smartphones.
These UK smartphone usage statistics show how much people are using the mobile internet on their smartphones. Based on Statista’s research the number of mobile internet users didn’t change much over the past couple of years.
The 4G network has download speeds that are 20 times faster than 3G. Interestingly, the maximum speed a 4G can develop is 300 Mbps, but only under ideal conditions. We still have to wait and see how the 5G network will change the game.
It’s worth pointing out that these numbers are, undoubtedly, higher due to COVID-19 Pandemic since people spend more time at home and surfing the internet.
Time spent on phones in the UK is unsurprising considering smartphones are used for a plethora of things these days. Using phones for business purposes such as making video calls, writing emails, reading pdf documents, to name but a few contribute to it greatly.
If you’re wondering how much people use search engines via smartphones, look below.
According to StatCounter’s web traffic analysis tool, whose analysis took into account 15 billion searches per month, people who had used smartphones, computers, and tablets searched the web using Google, which makes Google’s UK mobile market share 97,5 per cent in 2021.
In the next part, we’ll provide information on mobile trends growth, so stay with us.
Smartphone Usage Statistics UK: Growth Trends
As we mentioned before, in 2021, 99 per cent of people who are 16 to 34 years old owned a smartphone. It is assumed that people who are 35+ years old don’t use mobile phones as much as Millennials.
What’s interesting is the statistics that show that individuals who are aged 55 years or older use smartphones more and more each year. In 2016, 42 per cent of this age group used smartphones, and in 2018 that number was 50 per cent. In 2021, the figure of smartphone users aged 55 or older rose to 83%. All these numbers suggest that people of all ages use smartphones more than they used to in the past.
In the next section, we’re going to see how much the smartphone ownership rate has changed over the years, and what numbers we can expect in the future.
The Future of Mobile Usage in 2021 in the UK
Each year mobile phone use rises in the UK, and in the table below you’ll see a percentage of people who took Statista’s survey and answered if they use mobile phones.
| Year | Share of respondents using mobile phones |
| 2015 | 90% |
| 2017 | 94% |
| 2019 | 95% |
| 2020 | 95% |
| 2021 | 96% |
We can see that the numbers in 2020 and 2019 are even. In 2021, the number of mobile internet users in the UK reached 62.3 million, a figure which is projected to increase by approximately 2.86 million and amount to over 65 million by 2026.
The numbers we are going to present next are related to smartphone usage by age groups in the United Kingdom.
Smartphone Usage Statistics UK: Demographics
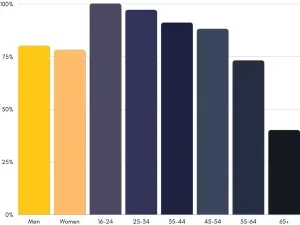
The first two bars represent the percentage of men and women in the UK who use smartphones to surf the web.
Now, will talk about the percentage of people who use mobile phones according to their age groups:
- The generation of baby boomers includes people who are aged from 56 to 74 years old. In the picture above, those are the two last bars. 73% of people who are aged 55 to 64 years use mobile phones, which is more than the people who are aged 65+, with 40%.
- Generation X are people who are 40 to 55 years old, and according to Statista’s survey, 88% of this generation use mobile phones.
- Generation Y, or Millennials, includes people who are 25 to 39 years old. This generation is divided into two age groups 25-34 and 35-44. In the picture above, we can see that 97% of younger Millennials use mobile phones, in comparison to 91% of older Millennials.
- Generation Z includes users who are aged from 16 to 24 years old. As we already mentioned, based on the research, 100% of Gen Z users use mobile phones.
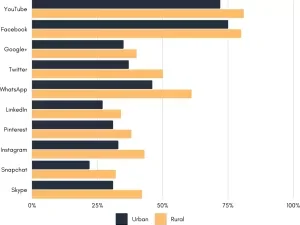
The next part is related to a comparison between users in rural and urban areas.
In 2021, smartphone usage to go online in the UK was highest among people aged between 35 and 44 years old. 93% of people in this age group reported using smartphones to browse the internet.
The percentage was lowest for people in the 65+ age range, with 59% using a smartphone to browse the internet.
What activity do you engage in the most on your smartphone? For sure, there are at least two or three that you do regularly.
Most-Frequent Mobile Phone Activities In the UK
| Activities | Share of respondents |
| Email service | 85% |
| Searching for goods and services | 81% |
| Internet banking | 76% |
| Messaging apps | 71% |
| Social media networks | 70% |
| Reading online magazines and news | 70% |
| Listening and downloading music | 62% |
| Searching for health advice | 60% |
| Making video or voice calls | 49% |
| Playing games | 41% |
| Selling services or goods on the internet | 21% |
Are you aware of how many times per day you check your email inbox? We assume at least a few times during the day. On weekly basis, 63% of mobile users in the UK access email messages via their phone. As you can see, out of all activities, people who completed the questionnaire said they used email service the most, the next thing they did was to search for information about services and goods, followed by internet banking.
Some of the most popular mobile games in the UK are Candy Crush Saga and Clash of Clans.
After learning what are the most used mobile services in the UK, it’s time to find out what mobile phone operating systems are most common in the UK.
Popular Operating Systems among UK Mobile Users
According to Statista’s smartphone statistics, in September 2020, Android had an operating system market share of 53.1%, while iOS had 46.65. Things changed a bit because, in October 2020, iOS’s market share was the largest with 52.94%. Combined, Android and iOS have over 99 per cent of the overall market share for mobile operating systems in the UK.
Android and iOS have been predominant operating systems in the smartphone industry since the creation of smartphones.
Once you have taken in how many people have smartphones in the UK and what operating system they have, it’s time to find out what brand they prefer buying.
Smartphone Usage Statistics UK: Popular Mobile Brands
StatCounter's data regarding the mobile vendor market share in the UK in 2021 shows that:
In 2020, when asked what would be their most preferred brand for future purchases, 82 per cent declared Samsung as their go-to brand, establishing it as a forerunner in the mobile phone industry in the UK, for 2021. It is interesting to note, around half of the respondents were using a smartphone no more than a year old.
The smartphone ownership rate began to increase as people of all ages started using smartphones. A large portion of smartphone users are still the younger generations, and Apple’s phones are for the time being the most popular phones in the UK.
Now, let’s take a look at what are the most used apps in the UK. On a daily basis, how many of them do you use?
Most Popular Websites and Apps
Apple’s Safari has a 51.5% browser share of total search visits on mobile devices. It's important to note that Apple’s share of the browser market is less than its share of the device market. Why, you ask? Since Safari comes pre-installed on Apple smartphones, this would suggest some of its users favour Google Chrome or other browsers over Safari more.
We already mentioned that Facebook is one of the most-used apps in the UK. Here are Facebook mobile app download stats, from October 2019.
It's not really surprising anymore that Facebook is the most popular app, is it? However, we can safely say that some of the new apps have a chance of competing with, and even surpassing Facebook when it comes to the most popular social media applications in the UK. Some of those platforms are Snapchat and TikTok, which we will talk about in the rest of the article.
YouTube
If we think about it. YouTube does not have any real competition, since it is the only video application in the world with this kind of popularity. Let's be real - everyone and their mom knows about YouTube, and that's surely not going to change any time soon.
Now you might be wondering - where is the statistic of Instagram downloads from the Apple App Store? Well, according to Statista, Instagram never made it to the top ten leading social networking iPhone apps, based on the number of downloads in Great Britain, in September 2020.
Amazon
As the most popular shopping website, Amazon generated the highest number of mobile visitors, holding first place in website visits on mobile devices in the UK.
Snapchat
- In May 2020, based on Android and iOS devices, Snapchat had approximately 10.5 million active users in the UK.
- In October 2019, there were roughly 287 thousand Snapchat downloads from the App Store to iPhones in the UK.
- In October 2021, Snapchat was the second most popular app on the Google Play store among users in Great Britain, with roughly 317 thousand downloads
TikTok
- At the end of 2019, over 25% of smartphone users in the UK aged 18 to 24 used TikTok.
- In October 2021, Tik Tok was the leading entertainment app downloaded onto iPhones in Great Britain, with roughly 446 thousand downloads from the Apple App Store.
- In October 2021,TikTok was the most popular social media app among users in Great Britain, with over 527 thousand downloads to Android devices.
- From February 2020, Twitter stats showed there were over 162 thousand Twitter downloads to iPhones in the United Kingdom.
- In March 2020, the number of Twitter app downloads to android devices in the UK was roughly 150.2 thousand, Statista revealed.
- According to a survey run in the United Kingdom during the third quarter of 2020, WhatsApp was the most popular mobile app among 26 to 35-year-olds.
- Not to mention that as of October 2021, WhatsApp was the most popular app on Apple App Store in the UK, with approximately 791 thousand downloads.
Due to the usage of WhatsApp and similar mobile messenger apps, the numbers of SMS and MMS messages had decreased over recent years.
In the last part, we’ll talk about mobile internet in the UK, providers, their networks and speeds. Take a peek.
Top Mobile Internet Providers
In 2020, 39 million people used social media from their smartphones. When it comes to internet providers in the UK, here are the four major mobile internet providers: EE, Three, Vodafone, and O2. In the following table, you can find the bandwidth speeds they provide, as well as measured latency.
| Network Name | Download speed (Mbps) | Upload speed (Mbps) | Latency (Mbps) |
| EE | 35.9 | 9.7 | 37.4 |
| Three | 19.1 | 7.4 | 51.7 |
| Vodafone | 25.4 | 6.7 | 41.5 |
| O2 | 16.6 | 5.8 | 41.9 |
If you look at the table above, you’ll see that EE is a leading provider regarding the 4G download and upload speeds, as well as latency time.
On the second place for its download speed (not including upload speed) is Vodafone, while Three has a higher upload speed than Vodafone and it holds third place.
When it comes to latency time, Vodafone is in second place, O2 third, and Three takes the last place.
3G, 4G, and 5G
| Network | Real Download Speed (Mbps) | Theoretical Download Speed (Mbps) | Upload Speed (Mbps) | Theoretical Upload Speed (Mbps) |
| 3G | 3 | 7.2 | 0.4 | 2 |
| 4G | 20 | 150 | 10 | 50 |
| 5G | 200 | 100 |
The 3G network is the slowest type, and people most commonly use it while surfing the internet. If you, for example, wanted to watch a video on YouTube, you’ll have to wait up to ten seconds to load.
The 4G network is faster, and if you want to watch a video on YouTube you will have to wait for about two seconds before it loads.
The 5G network is the fastest, and loading a video on YouTube is practically instant. However, there's a catch. 5G’s coverage is pretty narrow, the number of networks that offer it is limited. It’s available only in some UK cities, and on top of that, only a defined number of smartphones is actually compatible with 5G. Therefore we have to wait and see how 5G actually performs in the future.
Impacts of COVID-19
In a survey that took place in July 2020, amid the coronavirus pandemic, of 1000 people who answered questions, 46 per cent said that they use their smart devices more than pre-pandemic. Just shy of 25% answered that they use streaming devices and Smart TVs more often.
To Sum Up
As we can see from these statistics for Smartphone usage statistics in the UK, the number of people who use mobile phones is slowly but steadily on the rise. Understandably, thanks to COVID-19’s impact, the number of time people tend to spend on their phones increased tremendously.
Everybody has a different taste, so some individuals like to watch YouTube videos. Others prefer chatting on social networks like Facebook, Instagram, and Twitter. Indeed, there is something for everyone’s taste.
On a more personal note, I’m probably speaking on behalf of everyone when I say: “Thank you, IBM, for inventing the smartphone”